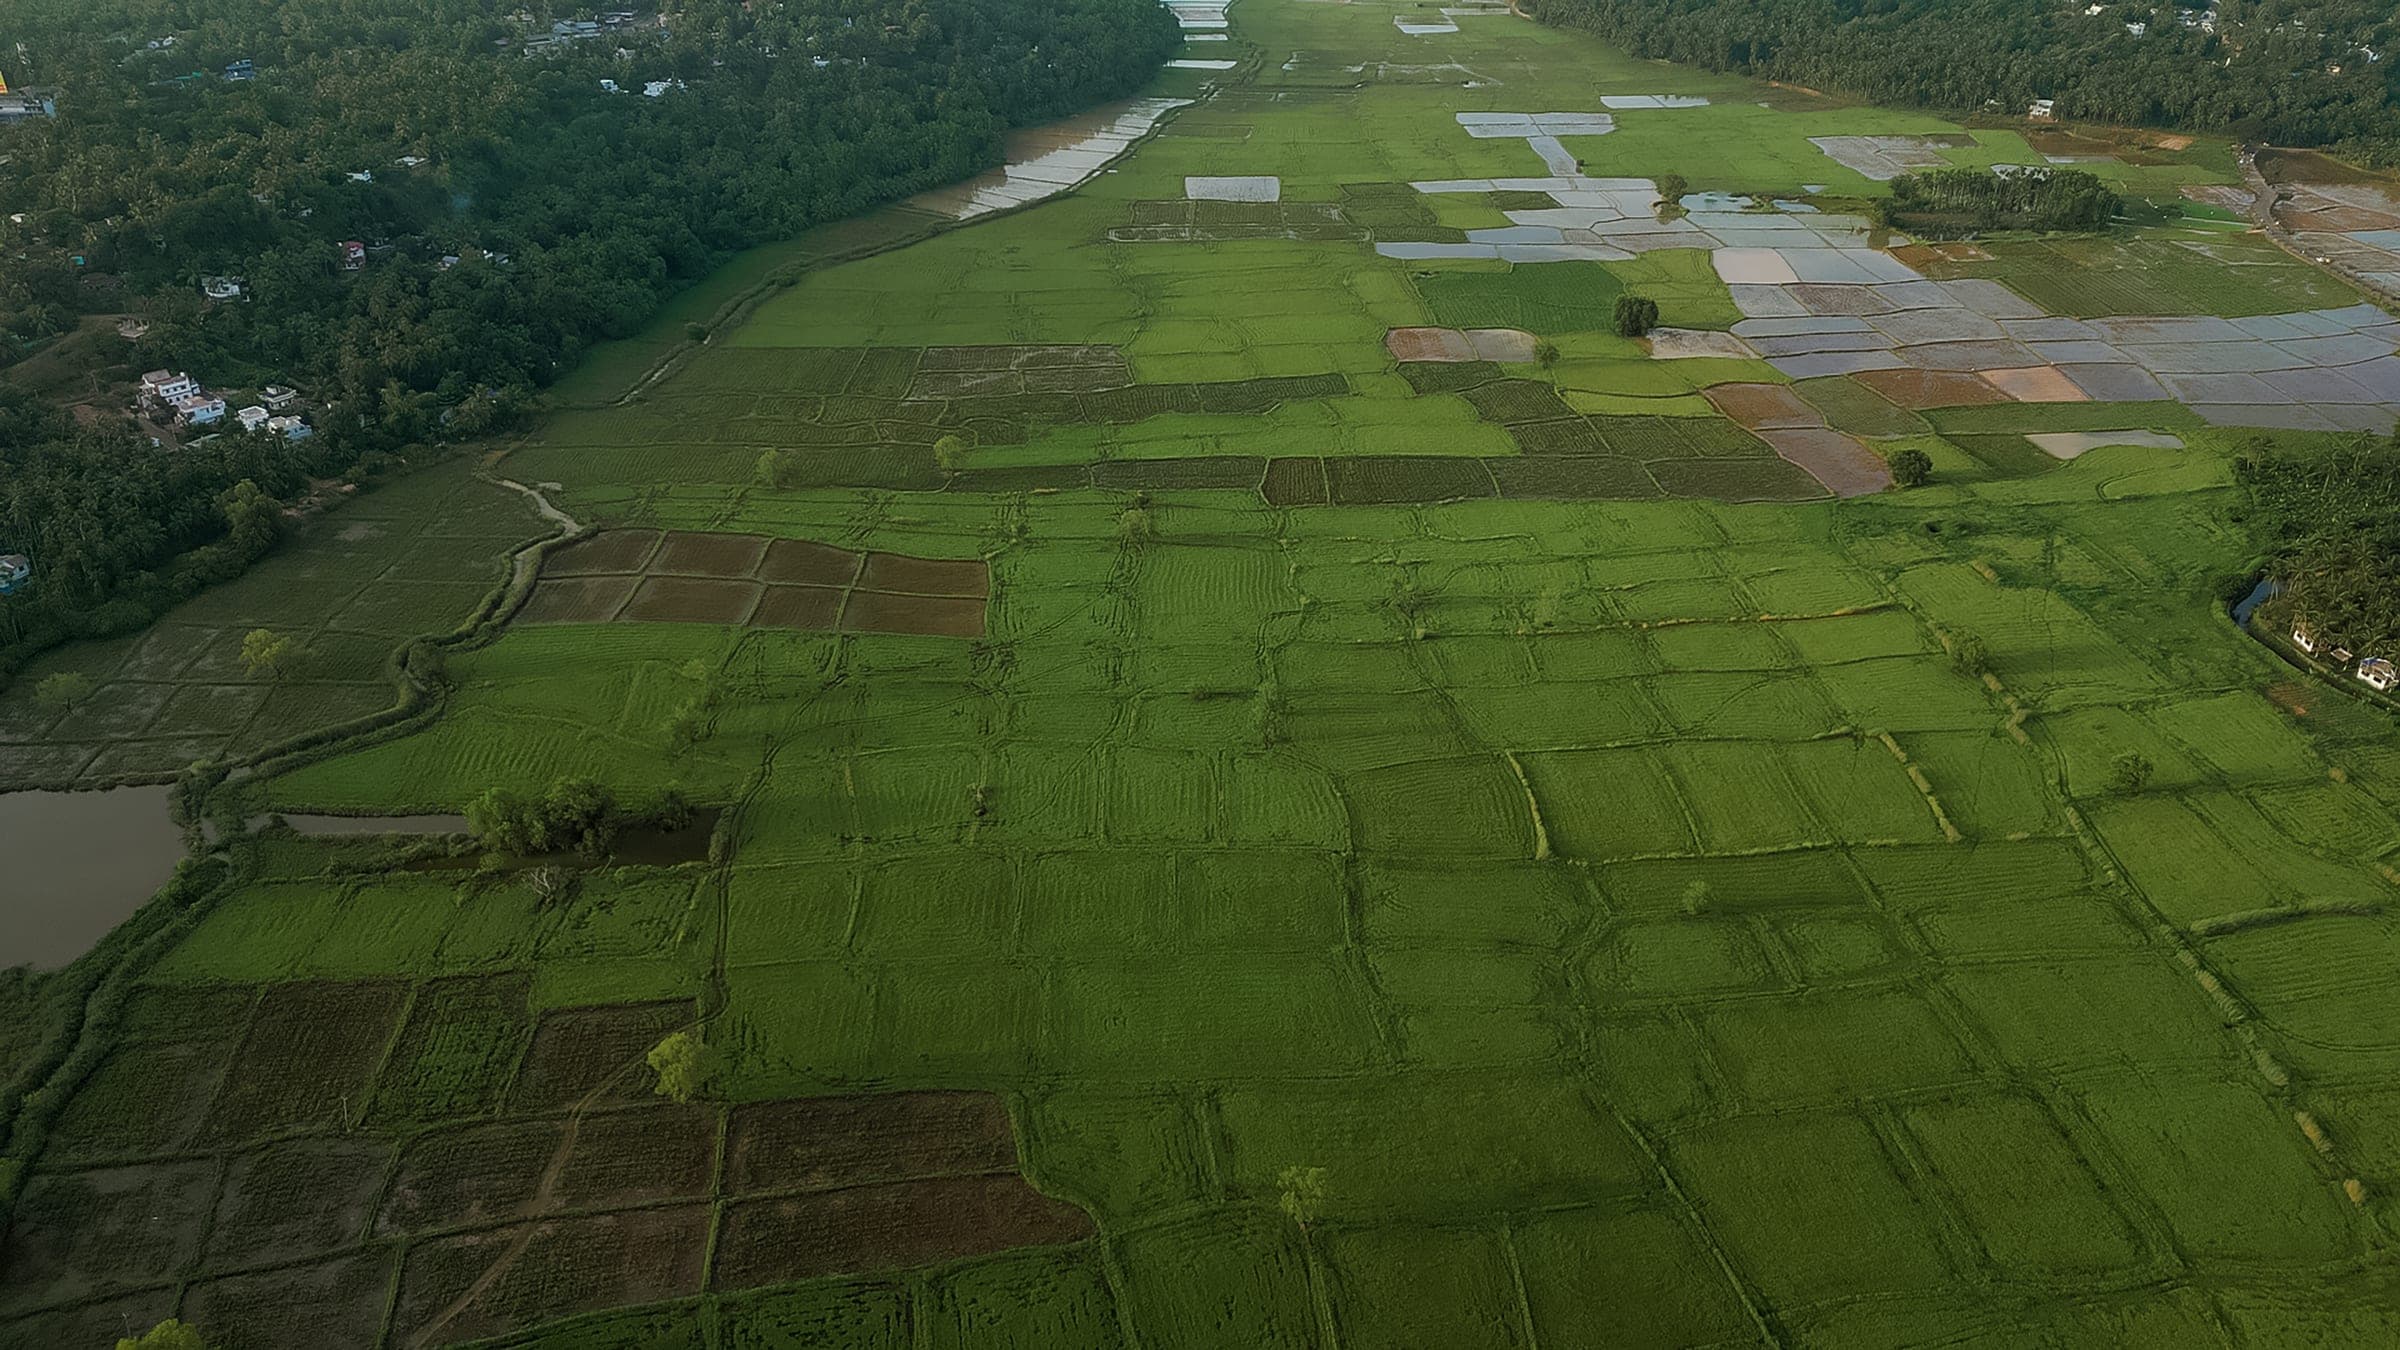
Bridging the trust deficit in agricultural insurance.
When disaster hits thousands of acres overnight, adjusters can't be everywhere. eSurvey turns the farmer's smartphone into a verified evidence chain: proof of loss for growers, and an automated fraud check for insurers.
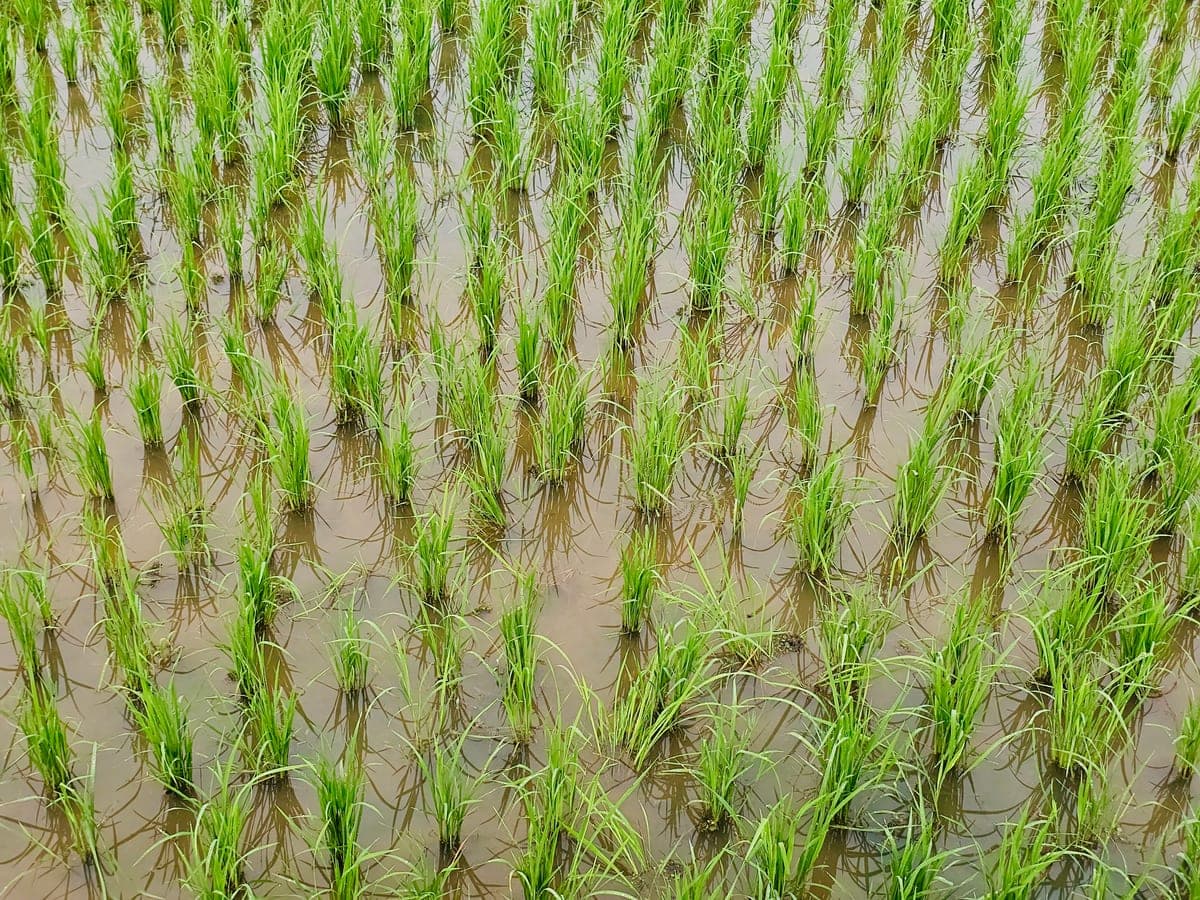
Survey ES-24-08817
Kuttanad, Kerala. Paddy, flood.
Verified in 4 minutes
- Geo-stamped at the plot
- Matches plot 142/3 boundary
- Satellite shows crop decline
- 212 mm rain recorded, 9–11 Aug
Why claims break down for both sides
Insurers can't verify. Farmers can't prove. Each side waits on the other, and a valid claim can stall for a whole season.
For the insurer
Disasters don't wait for adjusters
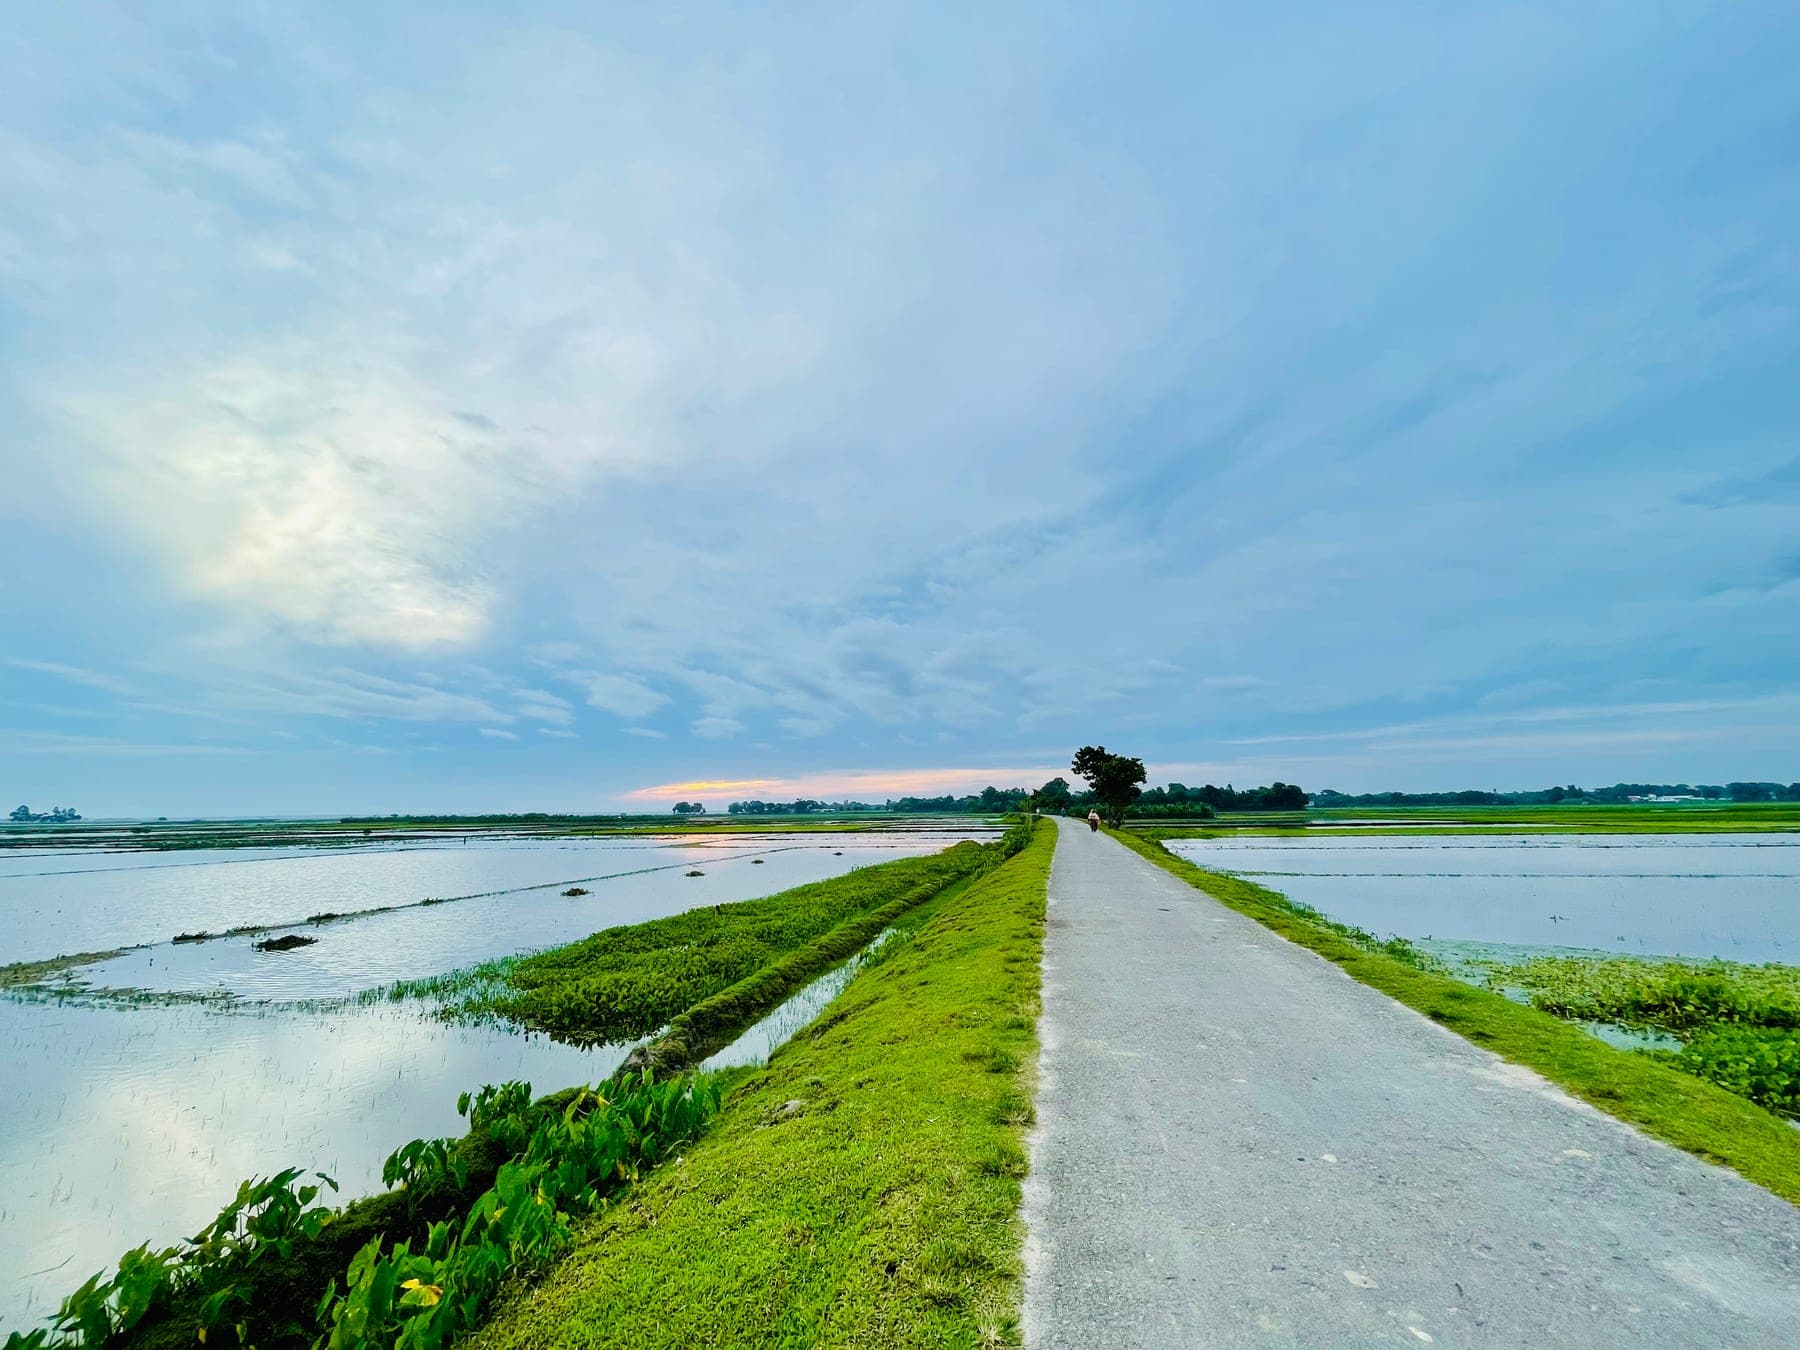
A flood or hailstorm hits thousands of acres at once. Visiting every field in person isn't physically possible.
Blind spots invite fraud
With little verified information, insurers are exposed to inflated or false claims, so they slow down and deny broadly just to stay safe.
For the farmer
IMG_2291.jpg
Photos get questioned
A standalone photo is easy to dispute. When was it taken? Where? Is it even this field?
Months of waiting
Valid claims sit in paperwork for months before anyone evaluates them, let alone pays out.
From guesswork to ground truth
Three steps take a claim from a flooded field to a report both sides can trust, in minutes rather than months.
The farmer surveys the plot
Right after the damage, the farmer walks the field and takes photos in the eSurvey app. Each photo is stamped with GPS position, time and compass heading at the moment it's taken, not typed in later.
Position
9.4290° N, 76.4178° E
Accuracy
±3 m
Captured
14 Aug 2026, 06:42
Heading
212° SW
eSurvey cross-checks every source
The photos are matched against the official plot boundary, satellite vegetation (NDVI) history for that exact field, and hyperlocal weather records. Every check is logged.
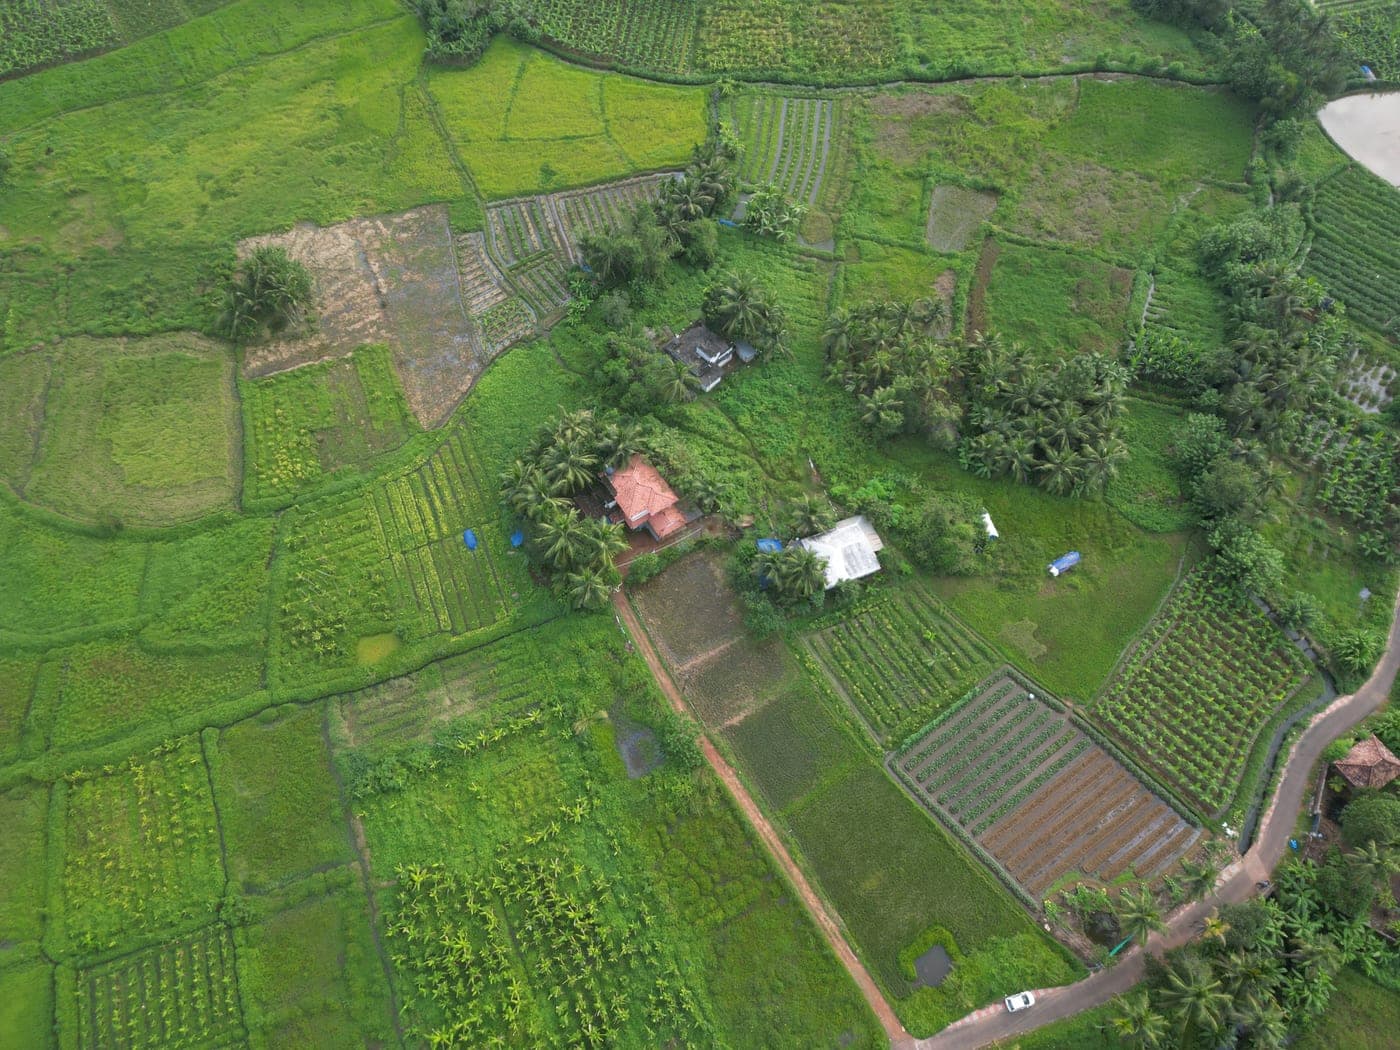
Checking your survey
- Plot boundarySurvey no. 142/3, 1.2 acres
- Satellite NDVICrop vigour down 54% since 9 Aug
- Weather grid212 mm rain in 72 hours
- Field photos4 of 4 taken inside the plot
Two identical copies, issued together
One audited report goes out twice at the same moment. The farmer holds proof of loss. The insurer holds the matching copy with its fraud checks. Both carry the same fingerprint, so any edit shows.
Insurer copy
14 Aug, 06:46
Loss report ES-24-08817
4 photos, all on plot- Peril
- Flood
- Crop
- Paddy, tillering
- Plot
- 142/3, 1.2 ac
- Assessed loss
- 68%
Farmer copy
14 Aug, 06:46
Loss report ES-24-08817
4 photos, all on plot- Peril
- Flood
- Crop
- Paddy, tillering
- Plot
- 142/3, 1.2 ac
- Assessed loss
- 68%
Your proof of loss is ready
The insurer received the identical report at the same time.
Evidence that holds up, from four directions
No single source decides a claim. eSurvey agrees a loss only when the photos, the land records, the satellite and the weather tell the same story.
eSurvey
Cadastral anchoring
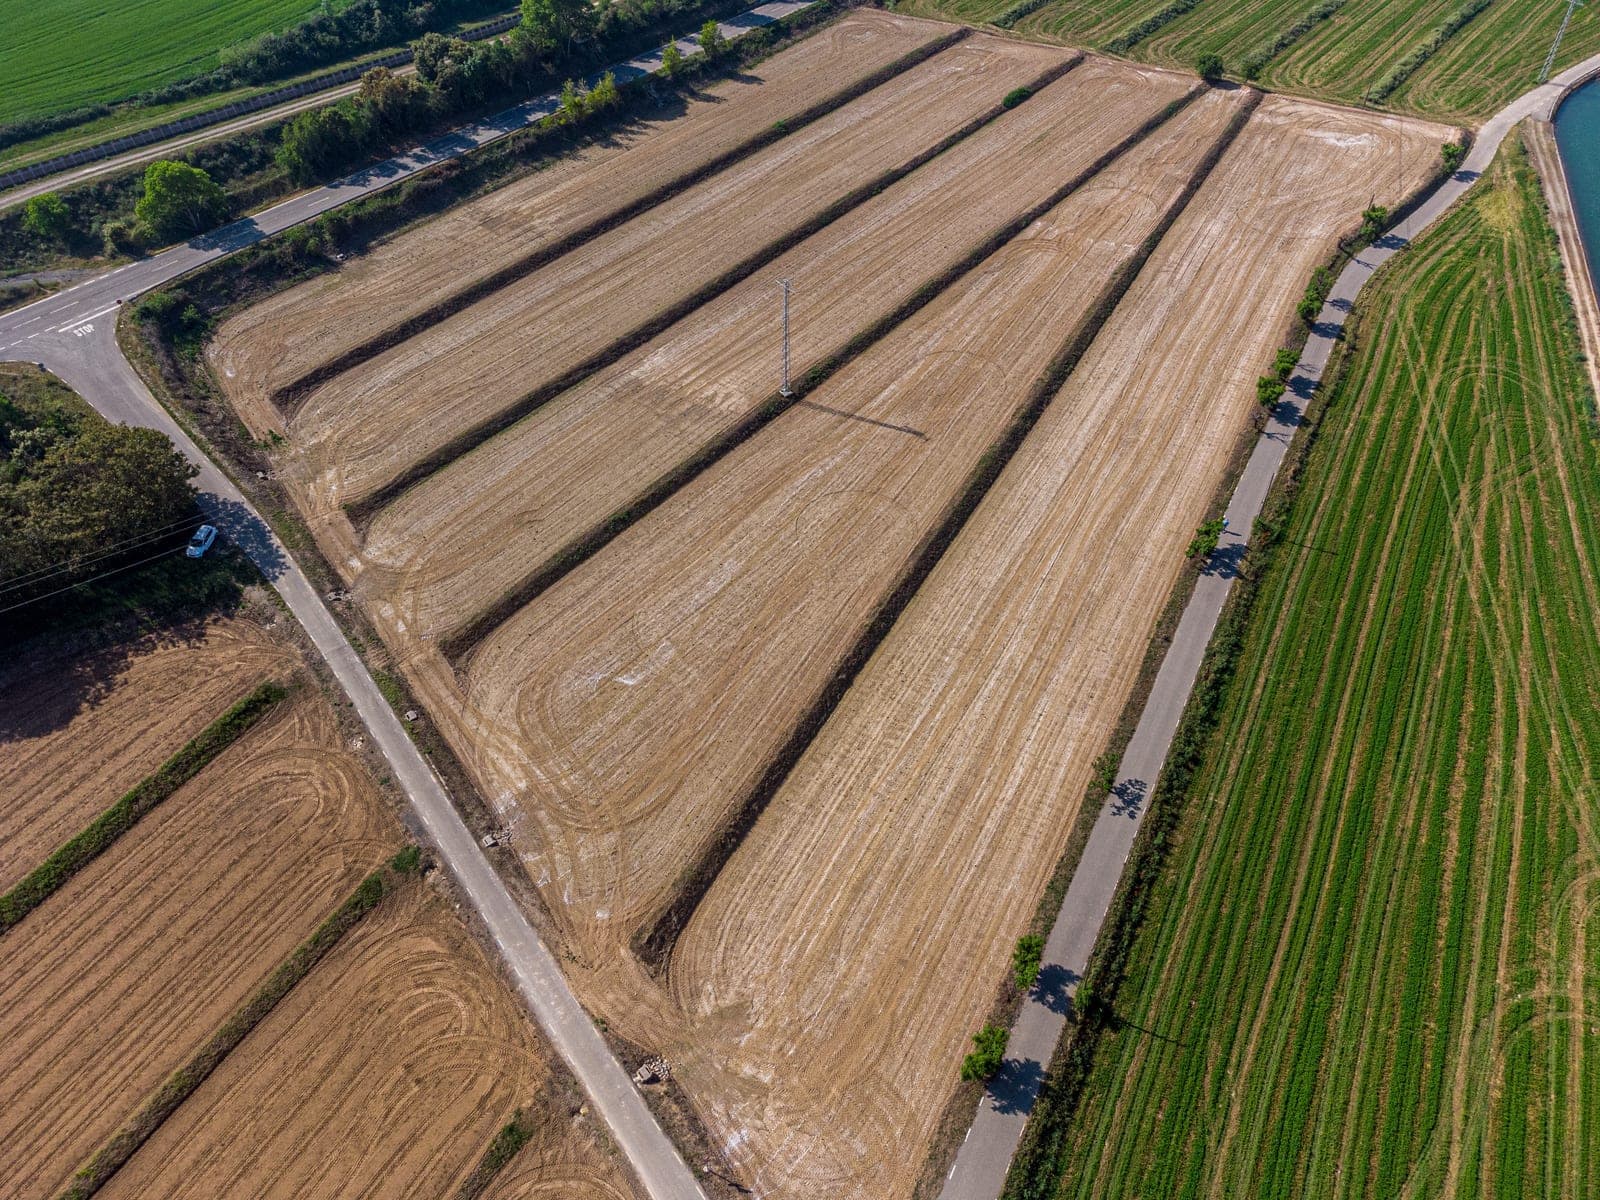
Every survey is tied to the official government plot boundary, so there's no argument about whose field it was or where it ends.
- Plot 142/3Saved on phone
- Plot 142/5Saved on phone
- Plot 97/2Saved on phone
Works without signal
Disaster zones lose coverage first. Surveys are stamped and sealed on the phone, then upload on their own once a signal returns.
Satellite and weather cross-checks
Did it actually rain that hard, on that field, before the crop declined? eSurvey checks the reported peril against weather records and the crop's own growth curve.
06:42:18
4 photos captured inside plot 142/3
06:43:02
Plot boundary matched, 1.2 acres
06:44:40
NDVI down 54% against 3-year baseline
06:45:11
212 mm rain, 9–11 Aug, nearest grid cell
06:46:05
Report sealed, copies sent to farmer and insurer
An audit trail anyone can read
Instead of a black-box percentage, every decision comes with the evidence behind it, step by step, in a report an adjuster, farmer or regulator can follow.
Built for muddy boots and busy desks
The same survey powers a simple app for farmers and field officers, and a claims queue for the insurer's team.
Namaskaram, Rajan
My plots
Rainfall, last 72 h
212 mm
Plot 142/3
Paddy
Plot 142/5
Paddy
Plot 88/1
Banana
Waiting to upload
Uploads start as soon as you're back in coverage.
Plot 142/3
ES-24-08817, sealed on device
Plot 142/5
ES-24-08818, sealed on device
Plot 97/2
ES-24-08821, sealed on device
Plot 97/4
ES-24-08822, sealed on device
Kuttanad block, Aug floods
Claims queue
Ready to settle
1,284
Needs review
37
ES-24-08817
Plot 142/3, loss 68%
ES-24-08790
Plot 61/8, loss 90%
ES-24-08802
Plot 17/2, loss 41%
ES-24-08811
Plot 23/1, loss 75%
ES-24-08815
Plot 142/5, loss 12%
Transform your risk assessment workflow today
See how eSurvey closes the gap between insurers and growers. We'll walk you through a live survey, from the field photo to both finished reports.